
.svg)


.png)


.png)


.png)


.svg)

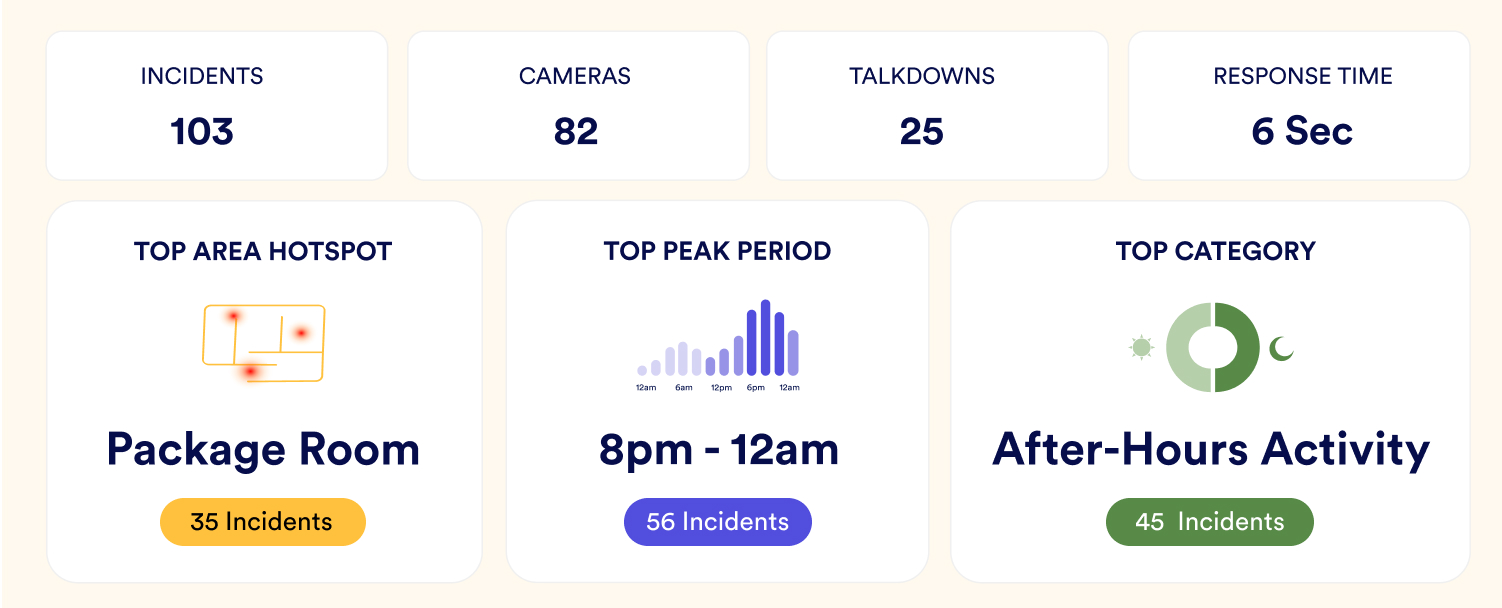
Know the Data Behind Every Incident
The portfolio view tells you where to look. The property view tells you what is happening and when. Every chart on this page answers a different question your security team should be asking every month.
Pinpoint the areas where incidents cluster most (By Area)
See which incident types drive your volume (By Category)
Spot the time when activity spikes by day, week or month (By Time)


.webp)


%20(1200%20x%20800%20px)%20(1200%20x%20627%20px)%20(YouTube%20Thumbnail)%20(3).webp)


.png)
.png)


